Technical Notes: Setting Up Prometheus + Grafana for Monitoring ML Systems
Recently, we deployed a microservice system for a Machine Learning application to an on-premises server. During the early stages of deployment, we quickly realized that monitoring was crucial to track system stability and performance metrics, especially for real-time applications. After researching various tools and solutions, we decided to deploy a Prometheus + Grafana stack to collect metrics and visualize the system's health.
Here are my detailed notes from the deployment process. These notes are quite specific and serve as a technical reference for anyone looking to implement a similar monitoring setup.
Why Prometheus + Grafana?
We chose this combination for the following reasons:
- Prometheus: Provides a robust, time-series database for collecting real-time metrics from various sources.
- Grafana: Offers interactive and customizable dashboards to visualize and analyze the collected data.
- Use Case: Specifically, we aimed to monitor model performance (e.g., latency, throughput) and the overall system health, including GPU usage and container metrics.
Features of the Setup
- Real-time Metrics: The stack collects data at a configurable interval (e.g., 5 seconds).
- GPU Monitoring: Leverages NVIDIA's DCGM exporter to monitor GPU utilization and memory.
- Container Monitoring: Uses cAdvisor to monitor Docker container performance.
- Custom Dashboards: Grafana allows the creation of tailored visualizations for specific metrics.
Deployment Using Docker Compose
The entire stack is orchestrated using Docker Compose. Below is the docker-compose.yml file we used:
1version: '3.8'2
3services:4 cadvisor:5 image: google/cadvisor:latest6 ports:7 - "8088:8080"8 volumes:9 - /:/rootfs:ro10 - /var/run:/var/run:rw11 - /sys:/sys:ro12 - /var/lib/docker/:/var/lib/docker:ro13 networks:14 - monitoring15
16 prometheus:17 image: prom/prometheus:latest18 volumes:19 - ./prometheus.yml:/etc/prometheus/prometheus.yml20 command:21 - '--config.file=/etc/prometheus/prometheus.yml'22 ports:23 - "9090:9090"24 networks:25 - monitoring26
27 grafana:28 image: grafana/grafana:latest29 ports:30 - "3000:3000"31 volumes:32 - grafana-storage:/var/lib/grafana33 networks:34 - monitoring35
36 nvidia-dcgm-exporter:37 image: nvidia/dcgm-exporter:latest38 deploy:39 resources:40 reservations:41 devices:42 - capabilities: [gpu]43 environment:44 - NVIDIA_VISIBLE_DEVICES=all45 ports:46 - "9400:9400"47 networks:48 - monitoring49
50networks:51 monitoring:52 driver: bridge53
54volumes:55 grafana-storage:Configuring Prometheus
Prometheus is configured to scrape metrics from cAdvisor and NVIDIA DCGM exporter. Here is the prometheus.yml file:
1global:2 scrape_interval: 5s3
4scrape_configs:5 - job_name: 'cadvisor'6 static_configs:7 - targets: ['cadvisor:8080']8
9 - job_name: 'nvidia-gpu'10 static_configs:11 - targets: ['nvidia-dcgm-exporter:9400']Custom Grafana Dashboards
Once Prometheus is set up, Grafana can query its data to visualize metrics. Below are some of the key panels we created:
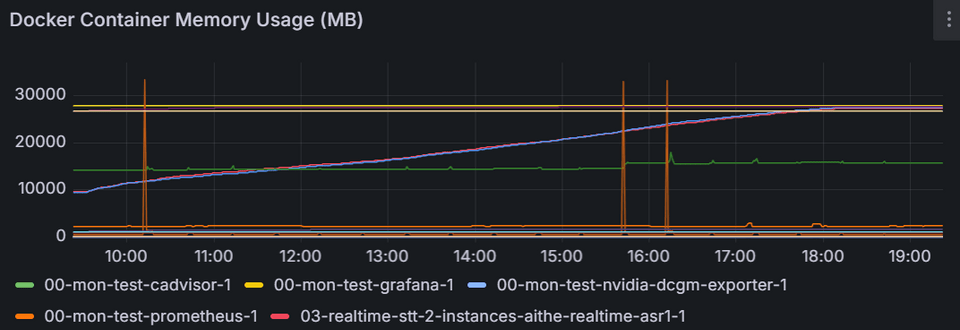
Docker Container Memory Usage (MB):
- Query:
sum(container_memory_usage_bytes{image!=""}) by (name) / 1024 / 1024
- Query:
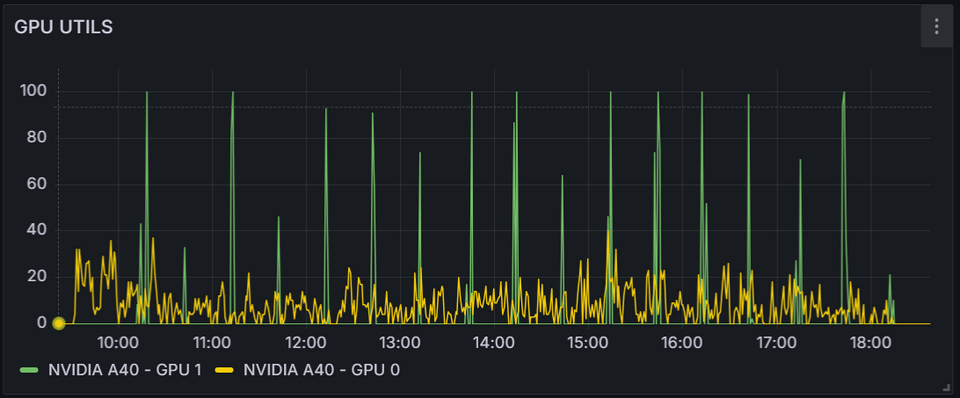
GPU Utilization:
- Query:
DCGM_FI_DEV_GPU_UTIL - Legend:
{{modelName}} - GPU {{gpu}}
- Query:
GPU Memory Usage (MB):
- Query:
DCGM_FI_DEV_FB_USED / 1024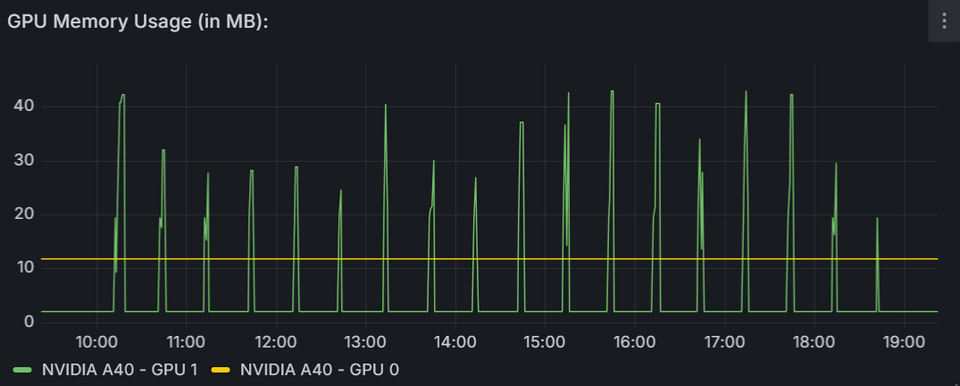
- Query:
Docker Container CPU Usage (Cores):
- Query:
sum(rate(container_cpu_usage_seconds_total{image!=""}[5m])) by (name)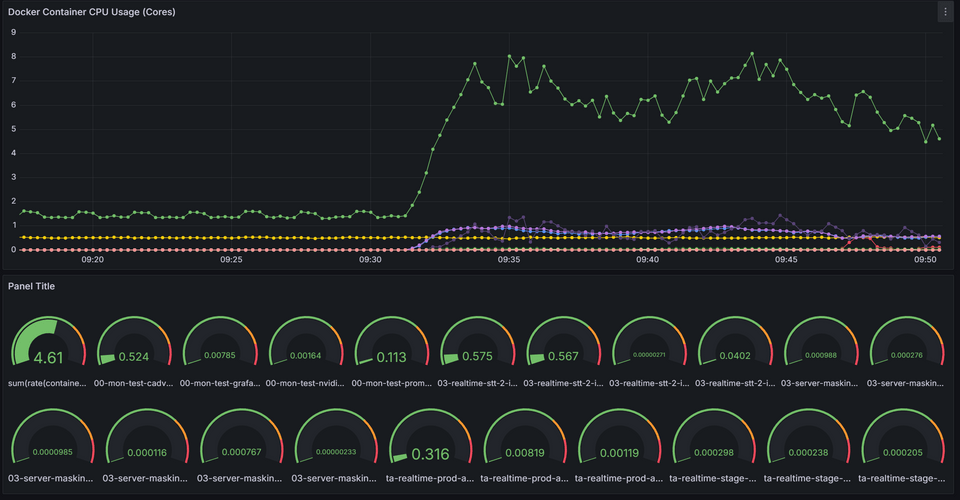
- Query:
Steps to Deploy the Stack
Prepare Files: Save the
docker-compose.ymlandprometheus.ymlfiles in the same directory.Start the Services: Run the following command to start the monitoring stack:
1docker-compose up -dAccess Web Interfaces:
- Prometheus: Visit
http://<server-ip>:9090to view raw metrics. - Grafana: Visit
http://<server-ip>:3000to create and view dashboards.
- Prometheus: Visit
Import Dashboards: Use the JSON model of your dashboard in Grafana to visualize metrics.
Summary
- Proactive Monitoring: Monitoring both GPU and container metrics is essential for optimizing performance in ML systems.
- Flexibility: The Prometheus + Grafana stack is highly customizable, making it suitable for diverse monitoring needs.
- Simplicity: Using Docker Compose simplifies deployment and maintenance of the stack.